


 17 / 168

Datasonic Group Berhad
(Company No. 809759-X)
15
Chairman’s Statement
(Continued)
In line with the lower revenue, Datasonic’s current profit after taxation (“PAT”) of RM62.892 million for FY16
also compared less favorably than the PAT of RM71.822 million reported in FY15. However, on a pro-rated
basis, the Group’s PAT was 9% higher than the previous financial year.
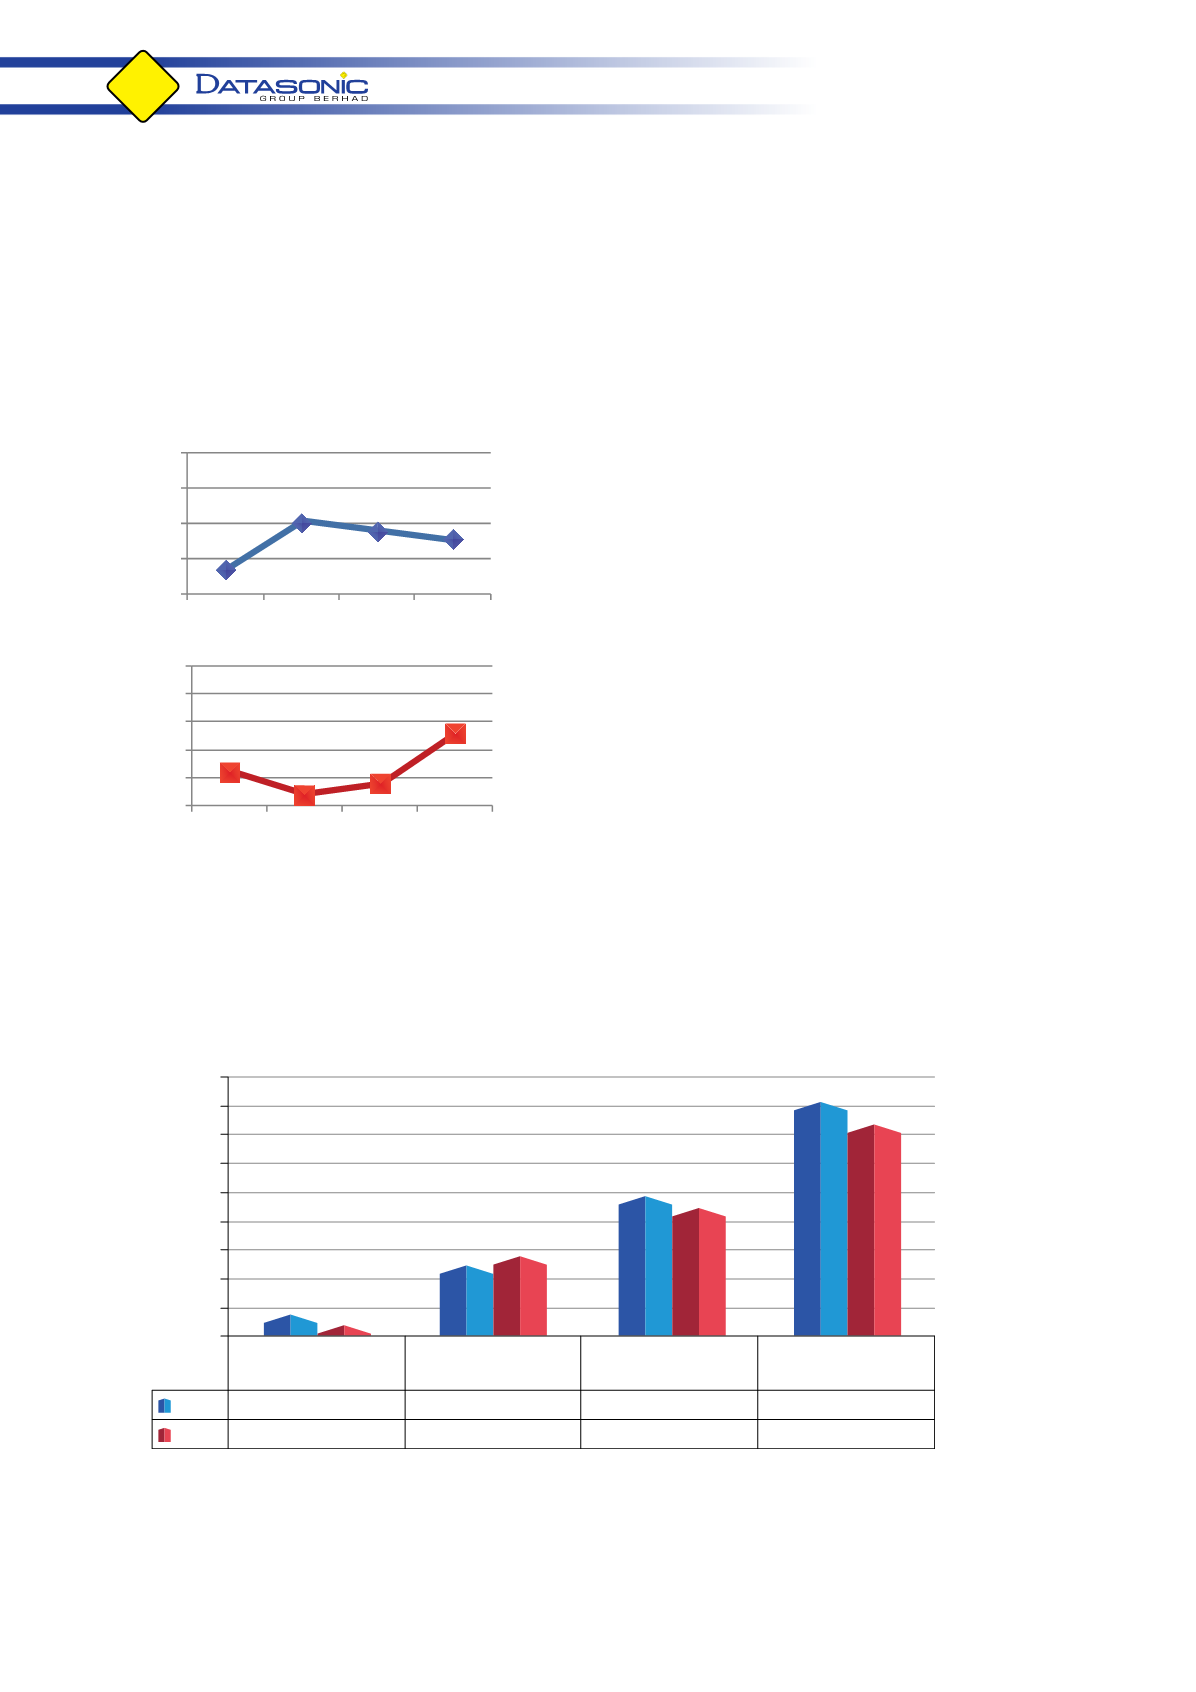
EPS and P/E Ratio
Year-on-year, Datasonic’s basic earnings per share (“EPS”)
has declined marginally from 5.33 sen in FY15 to 4.67 sen in
FY16 (or -12%) mainly due to the lower earnings reported in
the current year as a result of comparing 12 months for FY16
against 15 months for FY15.
Nevertheless, Datasonic’s Price to Earnings (“P/E”) Ratio has
shown an increase of 65% over the past 3 financial years
(from 17x in FY13 to 28x in FY16). Based on the market value
of RM1.30 per share as at 31 March 2016, our P/E ratio at 28
times indicates positive future performance.
Assets
Based on 1.35 billion shares of 10 sen each, Datasonic’s net
assets per share has increased by 1.67 sen (+10%) from 16.51
sen in FY15 to 18.18 sen in FY16.
Assets have increasedmainly due to increase in development
expenditures incurred from September 2015 to March 2016 for the development of the operating system
for the passport chips, in anticipation of the newly awarded contract for the supply of Malaysian passport
chips commencing 1 December 2016.
In addition, total trade receivables have also increased in the current year due to more deliveries towards
the end of the financial year.
Equity and Liabilities
Year-on-year, total Equity rose from RM222.859 million as at 31 March 2015 to RM245.250 million as at 31
March 2016 mainly due to increase in retained earnings less three (3) interim single-tier tax exempt dividends
amounting to RM40.5 million which were declared during the financial year.
Other Liabilities
Borrowings
Equity
Total Equity &
Liabilities
FY16
34.717
FY15
8.727
0
50
100
150
200
250
300
350
400
450
RM'million
EQUITY AND LIABILITIES
405.061
245.250
125.094
365.945
222.859
134.359
2.08
6.07 5.33 4.67
0
3
6
9
12
FY12 FY13 FY15 FY16
FY12 FY13 FY15 FY16
EPS (sen)
21
17
19
28
15
20
25
30
35
40
P/E Ratio (times)