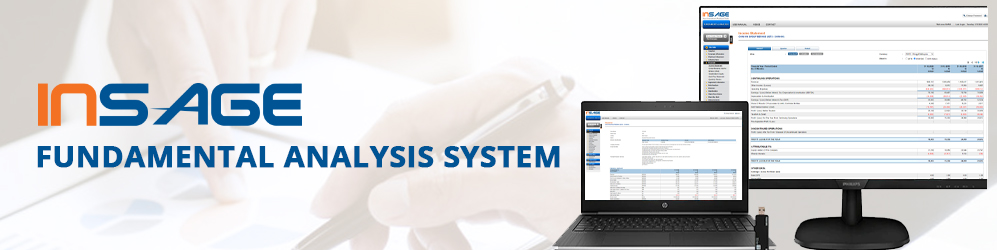
Insage Fundamental Analysis System
INSAGE Fundamental Analysis System enables you to analyse and review key information about a public listed company such as its historical financial performance, ratio analysis, management background, insider trades, share price-volume history and its latest announcements and news, and benchmark its performance against its competitors and markets. INSAGE Fundamental Analysis System enables you to critically look at the fundamental data that drives the value of a particular company.
The INSAGE Fundamental Analysis System provides a comprehensive set of data to enable an investor to make informed decisions. Our system consists of the following 13 sections:
|
|
Share Price Volume
The Share Price Volume history of a listed company is provided to enable investors to screen for the high and low prices and volume over a user-defined period.
3 different views are provided – Daily, Monthly, and High-Low.
Daily View, users can view the daily open, high, low, close, volume, value traded and average price.
Monthly View, users can view the month open, high, low, close, volume, value traded and average daily price, average daily value transacted and average daily volume transacted.
High-Low View, users can immediately obtain the following information for a user defined period:
- Highest Price and date
- Lowest Price and date
- Highest Volume and date
- Lowest Volume and date
Users can do a quick search to see Past 1 week, Past 1 Month, Past 3 Months, Past 6 Months or Past 1 Year (52 week) High and Low price and volume data.

|
|
|